
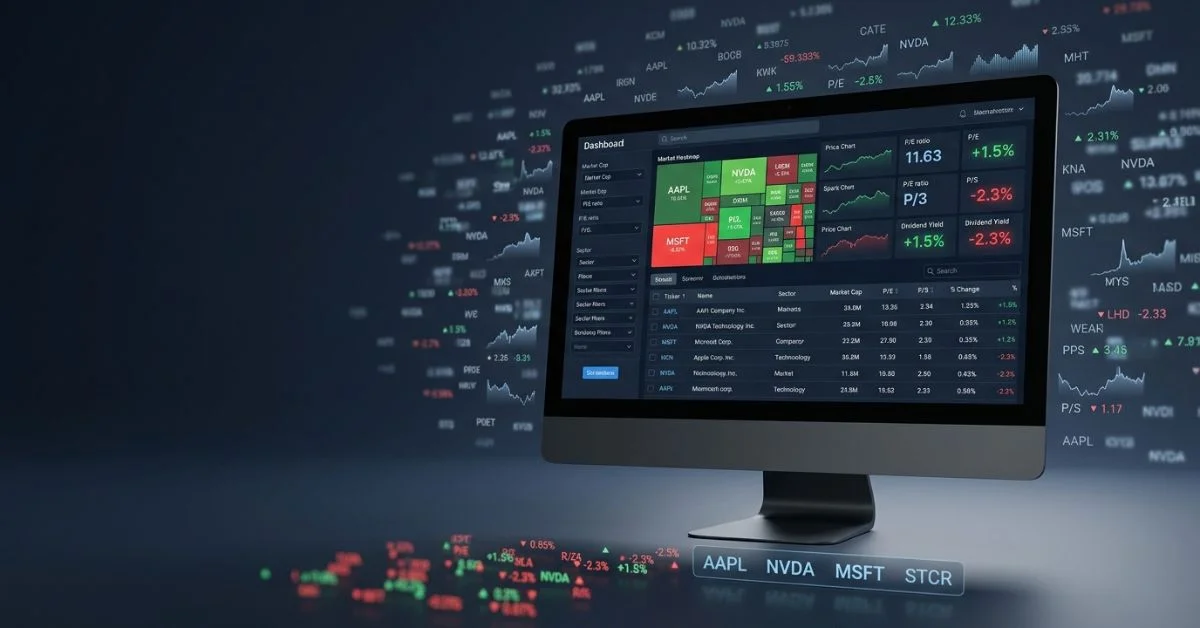
Finviz com is an online website used to search for stocks, track market movements, and study financial details. Finviz stands for Financial Visualization. It turns complex stock market numbers into easy-to-read tables, charts, and colorful maps. Investors and traders use it to check thousands of stocks quickly based on company health and price history.
- Main Use: Searching for stocks, tracking market trends, gathering news, and viewing color-coded market maps.
- Free Use: Yes, basic tools are free, but price numbers are delayed.
- Paid Plan: Finviz Elite ($24.95 to $39.50 per month).
- Live Price Data: Only on the Elite plan (Free price data is delayed by 15 to 20 minutes).
- Buying and Selling: No (Finviz is strictly a research website, not a stockbroker).
What Is Finviz and Who Is It For?
Finviz is a financial website that collects information on thousands of public companies and shows it using pictures and charts. It acts like a search engine for the stock market. Instead of looking up companies one at a time, you set rules to find stocks that match what you want.
Note: Finviz is purely a research tool. It is not a stockbroker. You cannot deposit money, buy shares, or sell stocks on Finviz. When you find a stock you like, you must log into your regular brokerage account to place your trade.
Finviz helps three main groups of people:
- Beginners: The colorful maps and ready-to-use search lists make it easy to see market movements without reading long financial reports.
- Long-Term Investors: Search filters like price-to-earnings (P/E) ratios, debt amounts, and cash dividend payouts help you find financially strong companies.
- Active Swing Traders: Price charts and trading volume rules help traders find stocks making big short-term price moves.
What Markets and Investments Does Finviz Cover?
Finviz mostly covers companies that trade on major US stock exchanges. It gives you access to several types of investments:
- US Stocks: Thousands of company shares listed on the New York Stock Exchange (NYSE), Nasdaq, and Cboe.
- Exchange-Traded Funds (ETFs): Groups of stocks bundled together into single funds that track entire market sectors or commodities.
- Foreign Stocks: Shares of international companies that trade on US exchanges through special stock certificates (ADRs).
- Futures & Forex: Major world trade goods, stock market indexes, global currencies, and cryptocurrencies for general tracking.
Key Features at a Glance
The table below shows what you can do on Finviz and how each tool helps you:
| Feature | Main Purpose | How It Helps You |
| Stock Screener | Filters stocks using special rules | Shrinks thousands of stocks down to a short list |
| Market Heatmaps | Color-coded market maps | Spots winning and losing market sectors fast |
| Stock Charts | Price movement graphs | Shows price trends, high points, and low points |
| News Aggregator | Live news feed | Tracks major company news and market updates |
| Group Performance | Industry and sector data | Shows where money is moving across different industries |
| Insider Trading Hub | Company insider tracking | Shows when company bosses buy or sell their own stock |
Is Finviz Free? (Free vs. Elite Comparison)
Finviz is free to use without making an account. Anyone can visit the site to view market maps, charts, and news, or use the basic stock search tool. Free price quotes and charts update with a 15 to 20-minute delay while the market is open.
You can also sign up for a free account. Creating an account lets you save your search rules, set up basic stock lists, and customize how the website looks.
For advanced users, Finviz Elite is a paid monthly plan. It offers live real-time price updates, advanced charting tools, strategy testing, and file downloading.
Free Plan vs. Finviz Elite
| Feature | Free Use (Without Account / With Account) | Finviz Elite (Paid Plan) |
| Price | $0 | $24.95/month (yearly plan) or $39.50/month |
| Data Speed | Delayed by 15–20 minutes | Live real-time prices & instant charts |
| Saved Searches | Up to 50 saved searches (with free account) | Unlimited saved searches |
| Download Data | Not available | Download data to CSV spreadsheet files |
| Custom Alerts | Not available | Email alerts for price changes, news, & insider trades |
| Strategy Testing | Not available | Test trading rules using up to 24 years of past data |
| Page Layout | Shows website ads | 100% ad-free view |

Does Finviz Have Real-Time Data?
Finviz provides live real-time data only to paid Finviz Elite members. For non-paying visitors and free accounts, market numbers, stock prices, and charts lag behind live market prices by 15 to 20 minutes.
- For Long-Term Investors: Delayed data is totally fine. If you plan to hold stocks for months or years, a 15-minute wait does not change your view of a company’s health.
- For Active Day Traders: Delayed data does not work for fast day trading. Day traders need second-by-second updates so they can make fast, precise trades.
How to Use the Finviz Stock Screener
The stock screener is Finviz’s main tool. It lets you narrow down thousands of stocks into a small watchlist in a few seconds. Search filters are divided into three main tabs:
1. Descriptive Filters
These rules focus on basic company facts:
- Market Cap: Filters companies by total dollar value (Mega, Large, Mid, Small, Micro).
- Sector & Industry: Isolates specific business fields, like Technology, Healthcare, or Banking.
- Average Volume: Filters by daily trading activity. Choosing a higher average volume makes sure you look at popular stocks that are easy to buy and sell.
2. Fundamental Filters
These rules check financial health and business profits:
- P/E Ratio (Price-to-Earnings): Compares the stock price to company profits. Lower numbers often mean a stock is cheap.
- EPS Growth (Earnings Per Share): Measures how fast company profits are growing.
- Dividend Yield: Shows the cash payment percentage paid out to stock owners each year.
- Debt/Equity: Compares company debt to net worth. Lower ratios mean safer borrowing levels.
3. Technical Filters
These rules look at price moves, trends, and chart shapes:
- 200-Day Simple Moving Average (SMA): Shows the overall long-term trend. Prices above this average line show long-term upward movement.
- RSI (Relative Strength Index): Measures if a stock has been bought too much (above 70) or sold too much (below 30).
- Relative Volume: Compares current trading activity to normal daily activity. High relative volume means higher trader interest.
5 Practical Screening Workflows
Here are five easy search recipes you can use right away. Copy these exact filter settings into the Finviz screener to create your watchlist:
1. Value Investor Search
Finds profitable, well-known companies trading at fair prices.
- Market Cap: Mid Cap ($2B+) or larger
- P/E Ratio: Under 15
- Price/Book: Under 2
- EPS Growth (Next 5 Years): Greater than 0%
- Debt/Equity: Under 0.5
2. High-Growth Stock Search
Finds fast-growing companies that are boosting their sales and profits quickly.
- EPS Growth (This Year): Over 20%
- EPS Growth (Next Year): Over 20%
- Sales Growth (Quarter Over Quarter): Over 15%
- Return on Equity (ROE): Over 15%
- 20-Day SMA: Price above SMA 20
3. Safe Dividend Search
Finds income-paying stocks with reliable cash payouts backed by good company profits.
- Dividend Yield: Over 3%
- Payout Ratio: Under 60% (makes sure profits easily cover the cash payout)
- Market Cap: Large Cap ($10B+)
- Current Ratio: Over 1.5 (checks short-term cash safety)
- Operating Margin: Over 10%
4. High-Momentum Search
Finds stocks breaking out to new high prices on heavy trading volume.
- Relative Volume: Over 1.5 (trading activity is 50% higher than normal)
- Current Volume: Over 500,000 shares
- 20-Day High/Low: New High
- Pattern: Multiple options like Channels or Breakouts
5. Swing Trader Reversal Search
Finds dropped stocks showing chart signs of bouncing back up.
- RSI (14): Oversold (under 30) or low (under 40)
- Performance (Month): Down
- 200-Day SMA: Price above SMA 200 (stays in an overall upward trend)
- Average Volume: Over 1 Million shares
Finviz Maps, Charts, News, and Other Tools
Finviz also offers several extra research tools alongside the stock search tool.
Visual Market Heatmaps
Heatmaps turn stock performance into color-coded box maps. Box size shows total company value, while color shows price movement (green for price gains, red for price losses). You can look at heatmaps for the S&P 500, world markets, or single sectors.
Stock Charts & Technical Views
Clicking any stock symbol opens its main details page. Finviz automatically draws support price lines, ceiling lines, and trend lines on daily charts.
News & Insider Hubs
The news hub gathers headline stories, economic reports, and market blogs from major news sources. The insider hub tracks official SEC legal reports, showing when company bosses buy or sell their own company shares.
A Better Finviz Research Workflow
Running a stock search alone does not mean you should buy immediately. A stock that shows up in your search is just a candidate, not a guaranteed buy signal. Always double-check your search results using this six-step process:
Step 1: Set Goals ---> Step 2: Run Search ---> Step 3: Check Volume
                                                      |
Step 6: Buy via Broker <--- Step 5: Check SEC Filings <--- Step 4: Check News
- Set Your Goals: Decide if you want long-term value, fast growth, or short-term swing trades.
- Run Your Search: Enter your chosen basic, financial, and chart rules into the screener.
- Check Trading Volume: Make sure the stock trades enough shares daily (for example, average volume over 500,000 shares) so you can enter and exit trades easily.
- Check Chart & News: Look at the chart for upcoming earnings release dates or big news stories that could cause fast price jumps or drops.
- Double-Check Financial Data: Match key company numbers against official government report filings (like Form 10-K or 10-Q reports).
- Make Trades through Your Broker: Log into your personal brokerage account to place your buy or sell orders.

Common Research Mistakes to Avoid
- Treating Searches as Buy Signals: Searches filter out weak stocks, but they do not promise future price gains. Always do manual checks.
- Ignoring Trading Volume: Low-volume stocks can have big price gaps and poor trade execution when you try to buy or sell.
- Using Too Many Rules: Adding too many strict search rules can leave you with zero matching stocks. Start wide and add rules step by step.
- Relying on Only One Number: A low P/E ratio by itself can mean a failing business rather than a cheap stock. Always check multiple financial numbers together.
Is Finviz Right for You?
Use this chart to match your trading style with Finviz tools:
| User Type | Fits Well? | Why Finviz Fits |
| Beginners | High | Colorful heatmaps make complex market data simple to scan. |
| Long-Term Investors | High | Great financial filters and easy checks on insider stock ownership. |
| Swing Traders | High | Automatic chart pattern tracking speeds up daily stock scans. |
| Day Traders | Medium | Free delayed price data is too slow; requires Finviz Elite for live prices. |
Top Finviz Alternatives
- TradingView: Best for advanced price charting, multi-market technical tools, and custom visual indicators.
- Stock Rover: Best for deep financial research, portfolio tracking, and long-term dividend evaluation.
- Barchart: Strong choice for options traders, futures data, and physical commodity screening.
- Seeking Alpha: Best for crowd-written investment research, earnings report transcripts, and stock analysis articles.
Frequently Asked Questions
What is Finviz?
Finviz is a financial visualization and stock search website. It helps investors research stocks, track markets, and study price trends using colorful maps, tables, and charts.
Is Finviz free to use?
Yes, basic features are free to use without creating an account. The free version includes search rules, charts, news, and market maps, but market data is delayed by 15 to 20 minutes.
Is Finviz a broker?
No. Finviz is purely a research website. You cannot place trades or manage money directly on Finviz. You must use a separate stockbroker account to make trades.
Does Finviz have real-time data?
Live real-time market data is available only to paid Finviz Elite subscribers. Non-paying users get stock prices delayed by 15 to 20 minutes.
Is Finviz Elite worth the price?
Finviz Elite ($24.95 to $39.50 per month) is worth buying for active traders who need live prices, email alerts, strategy testing tools, and data spreadsheet downloads. Long-term investors can usually stick with the free tier.
Is Finviz good for beginners?
Yes, Finviz is easy for beginners to use. Its visual heatmaps and ready-made search lists make it easy for new investors to spot market trends and organize their stock research.
You Could Also Like:
PressZoomWave com Review 2026: Is It Worth Publishing On for SEO & PR?
Zenvekeypo4 Software Problem: Causes, Fixes & Troubleshooting Guide (2026)
Disclaimer:
This article is for informational and educational purposes only. It does not provide financial, investment, trading, or legal advice. Always verify financial information and make decisions based on your own research. Some images may be AI-generated for illustrative purposes. All copyrights, trademarks, and brand names belong to their respective owners.

Victor Rennard is a multi-niche writer for BaddieHubMagazine.com, creating clear and engaging articles across lifestyle, trends, tech, entertainment, and general guides. With a simple, helpful writing style, Victor aims to give readers quick insights and reliable information on topics that matter.


